One of the most powerful forces in financial markets is institutional activity. While retail traders often focus on short-term fluctuations and headlines, the largest and most influential market players—banks, hedge funds, asset managers, and proprietary trading firms—operate on a different level. They move billions of dollars and leave subtle footprints in the market.
A critical concept for traders is accumulation, which refers to the phase where institutions quietly build large positions before a major uptrend. Understanding how to identify accumulation can give retail traders an edge by aligning with the smart money instead of fighting against it.
This article explores what accumulation is, why institutions accumulate before an uptrend, the signs of accumulation, and how traders can use this knowledge to build profitable strategies.
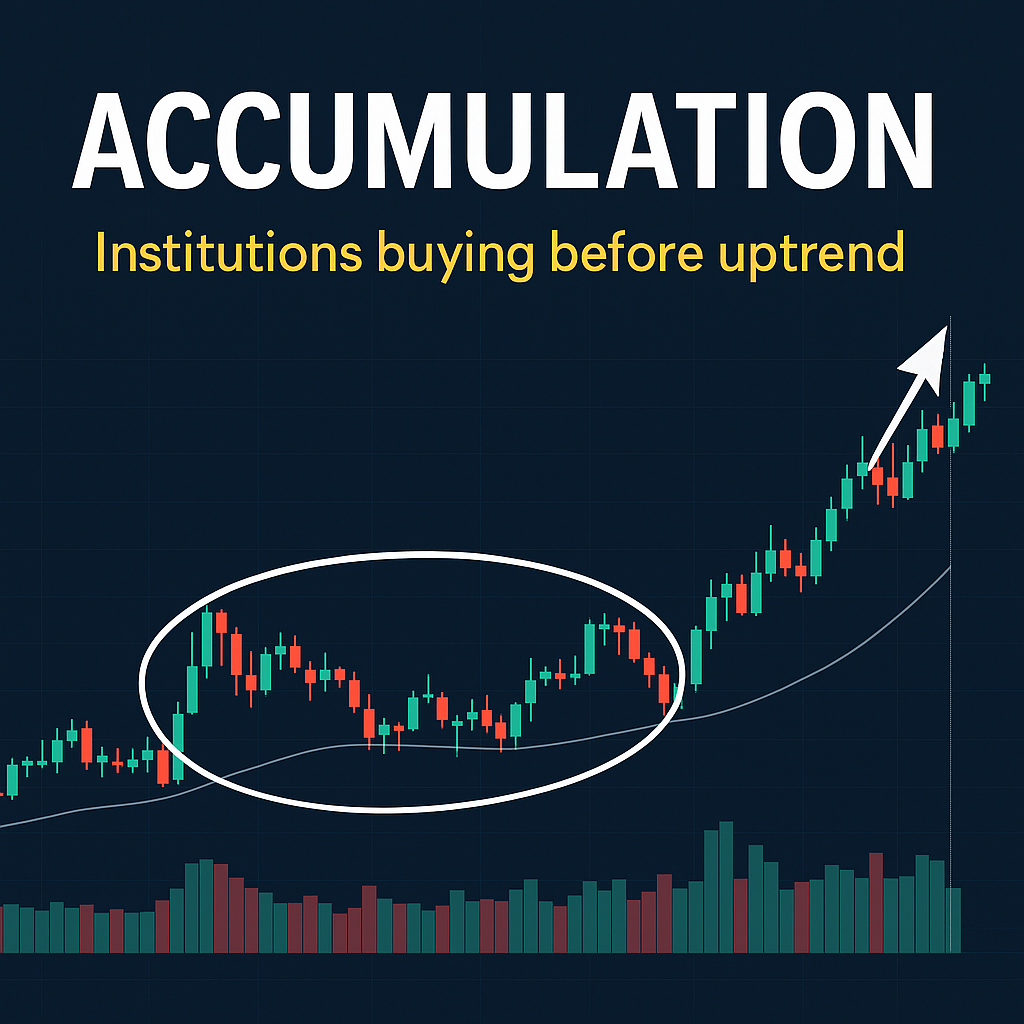
1. What Is Accumulation?
Accumulation is the process where large market participants slowly and strategically purchase an asset—such as a stock, currency, or commodity—over time without significantly driving up the price. This is not done all at once, because placing massive orders would quickly raise prices and alert others to their intentions. Instead, institutions accumulate gradually, often disguising their activity within normal market noise.
Key characteristics of accumulation:
- Happens after a downtrend or a prolonged sideways range.
- Involves large but hidden buying pressure.
- Precedes an eventual breakout or sustained uptrend.
- Accompanied by higher volume on up days and lower volume on down days.
For retail traders, identifying this phase is crucial because it signals the early stages of a potential trend reversal.
2. Why Do Institutions Accumulate?
Institutions cannot enter the market the same way individual traders do. For example, if a hedge fund wants to buy 50 million shares of a stock, placing that order all at once would cause the price to skyrocket instantly. To avoid slippage and unnecessary attention, they accumulate slowly.
Reasons for accumulation:
- Position Building: They need time to enter large trades discreetly.
- Value Investing: Institutions identify undervalued assets and acquire them before the broader market realizes.
- Market Manipulation: Sometimes institutions intentionally hold prices within a range to keep supply available until they finish buying.
- Preparation for Distribution: After accumulation and an uptrend, institutions later offload (distribute) their holdings at higher prices.
In essence, accumulation is about stealth, patience, and preparation for significant moves.
3. The Market Cycle: Accumulation as the First Phase
Markets typically move in cycles. The Wyckoff Method, developed by Richard Wyckoff, describes these phases as:
- Accumulation Phase – Smart money builds positions.
- Markup Phase – Prices rise as demand outweighs supply.
- Distribution Phase – Institutions sell their holdings to latecomers.
- Markdown Phase – Prices fall after distribution.
Recognizing the accumulation phase allows traders to position themselves at the beginning of the cycle, where risk is lowest and profit potential is greatest.
4. Signs of Accumulation
Spotting accumulation requires paying attention to price action, volume, and market structure.
a) Price Consolidation
Accumulation often occurs in a sideways range after a decline. Prices seem stagnant, with neither bulls nor bears dominating. This creates the illusion of market indecision, but under the surface, institutions are absorbing supply.
b) Volume Patterns
Volume is one of the strongest indicators of accumulation:
- Higher volume on up days, lower volume on down days.
- Spikes in volume near support levels, followed by price recovery.
- Gradual increase in overall trading activity.
c) False Breakouts
Institutions may deliberately cause false breakdowns below support to shake out weak hands and trigger stop-losses, giving them more supply to accumulate.
d) Divergences
Technical indicators like RSI or MACD may show bullish divergence—momentum strengthens while price remains flat. This suggests hidden accumulation.
e) Lack of Follow-Through on Selling Pressure
Despite negative news or bearish sentiment, the market holds steady. This resilience can be a sign that institutions are absorbing supply.
5. How to Trade During Accumulation
Trading the accumulation phase requires patience and timing.
Step 1: Identify the Range
Mark support and resistance zones where price has been consolidating.
Step 2: Watch Volume and Price Action
Look for rising volume on rallies and diminishing volume on declines.
Step 3: Wait for Confirmation
The safest entry is after the breakout from the accumulation range, ideally with a surge in volume.
Step 4: Enter Early with Risk Control
Aggressive traders may enter near support within the range, but always use stop-losses in case accumulation turns into further decline.
Step 5: Ride the Uptrend
Once the breakout is confirmed, hold positions through the markup phase, trailing stops as the trend develops.
6. Real-World Example
Imagine a stock has fallen from $100 to $40. It then spends months moving between $38 and $45 with no clear trend. Volume is heavier when price rallies to $45 and lighter when it dips to $38. Eventually, the stock breaks above $45 with massive volume and begins trending higher toward $70, then $100.
What happened? Institutions likely accumulated during the range, absorbing shares at low prices before driving the market upward.
7. Institutional Tactics During Accumulation
Institutions often use specific tactics to mask their accumulation:
- Iceberg Orders: Large orders split into smaller ones to avoid detection.
- Dark Pools: Private exchanges where institutions trade away from public view.
- Algorithmic Buying: Automated systems to gradually accumulate with minimal impact.
- Stop-Loss Hunting: Forcing prices below support to trigger retail stops, then buying at a discount.
Retail traders should understand these tactics to avoid being shaken out prematurely.
8. Tools and Indicators to Spot Accumulation
Several technical tools can help confirm accumulation:
- Volume Profile: Shows where the most trading activity occurs within a range.
- On-Balance Volume (OBV): Tracks buying/selling pressure. A rising OBV during sideways movement signals accumulation.
- Moving Averages: Flattening and convergence after a decline can indicate stabilization.
- Wyckoff Schematics: Visual patterns showing phases of accumulation.
9. Psychology Behind Accumulation
Accumulation often occurs when retail traders are fearful. After a big decline, many investors panic-sell, believing the asset is doomed. Institutions take advantage of this pessimism by buying quietly. By the time the uptrend begins, most retail traders have already exited, only to re-enter later at much higher prices.
This psychological trap is why aligning with institutional behavior is so powerful.
10. Risks of Misinterpreting Accumulation
Not every sideways market is accumulation. Some are simply pauses before further decline, known as distribution or continuation patterns.
Risks include:
- False Breakouts: Entering too early before confirmation.
- Long Consolidation: Capital tied up in a range for months without progress.
- Misreading Volume: Assuming accumulation when volume is random.
Always combine multiple signals before acting.
11. Strategy for Retail Traders
- Focus on assets that have declined significantly but are stabilizing.
- Look for volume shifts indicating demand absorption.
- Confirm accumulation with divergence indicators.
- Enter after breakout or accumulate small positions near support.
- Manage risk with stop-losses and position sizing.
Conclusion
Accumulation is a hidden but powerful process where institutions build positions before a major uptrend. By learning to recognize the signs—sideways ranges, volume shifts, resilience against selling pressure, and false breakdowns—retail traders can align with institutional money instead of being caught against it.
Understanding accumulation gives you the opportunity to enter trades at the most favorable time: before the crowd realizes an uptrend is beginning. This knowledge, combined with discipline and risk management, forms a strong foundation for long-term success in trading.
Disclaimer
This article is for educational purposes only and does not constitute financial advice. Forex and stock trading carry significant risks and may not be suitable for all investors. Always conduct your own research or consult with a licensed financial advisor before making trading decisions.

CFDs Trading Explained: How Contracts for Difference Work, Risks Included
Many people enter the markets looking for clarity. They hear about forex, stocks, indices, and commodities, but they are still unsure how trading actually works.

Essential Trading Tools Every Serious Trader Uses (And How to Choose the Right Ones)
A practical overview of how a forex demo account works and what traders should know before getting started.

Trading News That Actually Matters: How to Filter Market Noise From Real Opportunity
Most traders do not lose because they are uninformed. They lose because they are overloaded. Trading news is constant. You can refresh your feed every

Trading Analysis Explained: How Professionals Read Markets Before Placing a Trade
Disclaimer (InvidiaTrade): This article is for educational purposes only and does not provide financial, investment, or trading advice. Trading carries risk, and you may lose

What Makes a Best Trading Platform?
https://www.youtube.com/watch?v=i17trtTkft8 When people search for the best trading platform, they often expect a single answer. In reality, “best” depends on what you trade, how you

Day Trading: What It Is, How It Works, and the Risks You Must Know
Day trading gets a lot of attention because it looks exciting. Trades happen quickly, charts move fast, and results show up in minutes instead of