Distribution

Distribution: Intro

In the world of financial markets, price movements are rarely random. Every major trend has an underlying cause, often rooted in the behavior of large players — the institutions, hedge funds, and market makers who control the majority of liquidity.

One of the most crucial concepts traders must understand is distribution. It is the phase where institutions sell their positions to retail traders before a significant downtrend begins.

Recognizing this pattern can help traders avoid buying at the top and instead position themselves profitably for the move that follows. In this article, we’ll explore:

  • The meaning of distribution in trading.
  • How institutions operate during distribution.
  • The signs and characteristics of distribution phases.
  • How distribution fits within market cycles.
  • Strategies for identifying and trading distribution.
  • Real-world examples of distribution leading to market downtrends.

By the end, you’ll have a deep understanding of distribution and why it’s one of the most important phases to recognize for long-term trading success.

Distribution

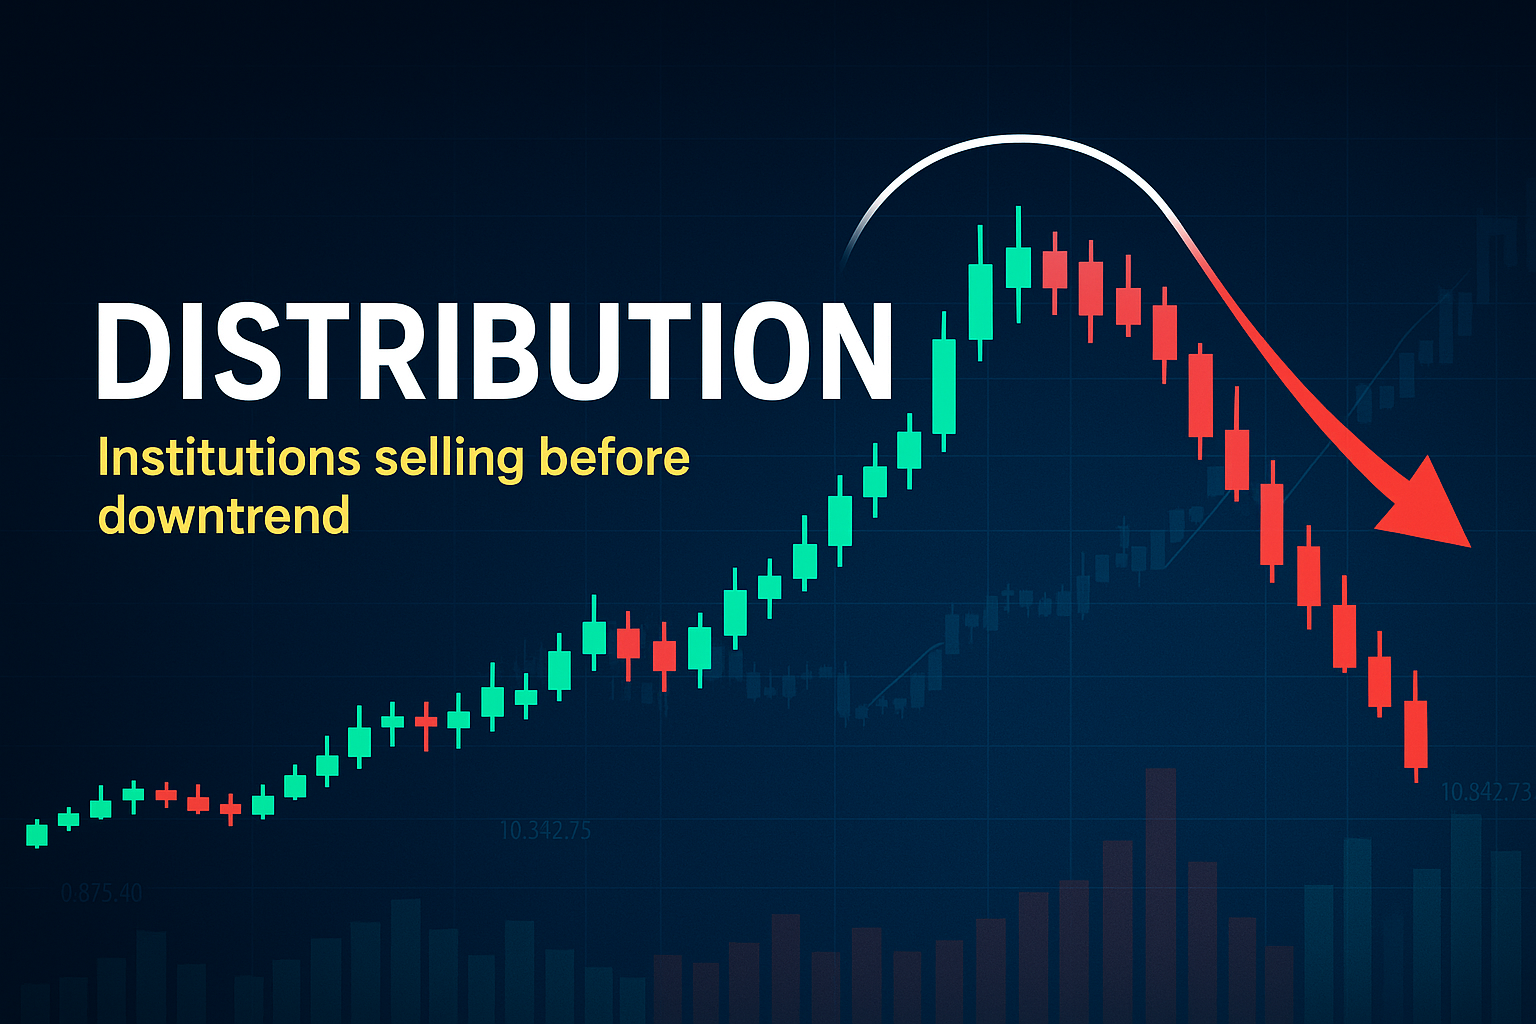
What Does Distribution Mean in Trading?

In simple terms, distribution is the phase of the market where institutions and smart money exit their long positions by selling to latecomers (mostly retail traders).

Here’s the key idea:

  • Institutions buy during accumulation (when prices are low and fear dominates the market).
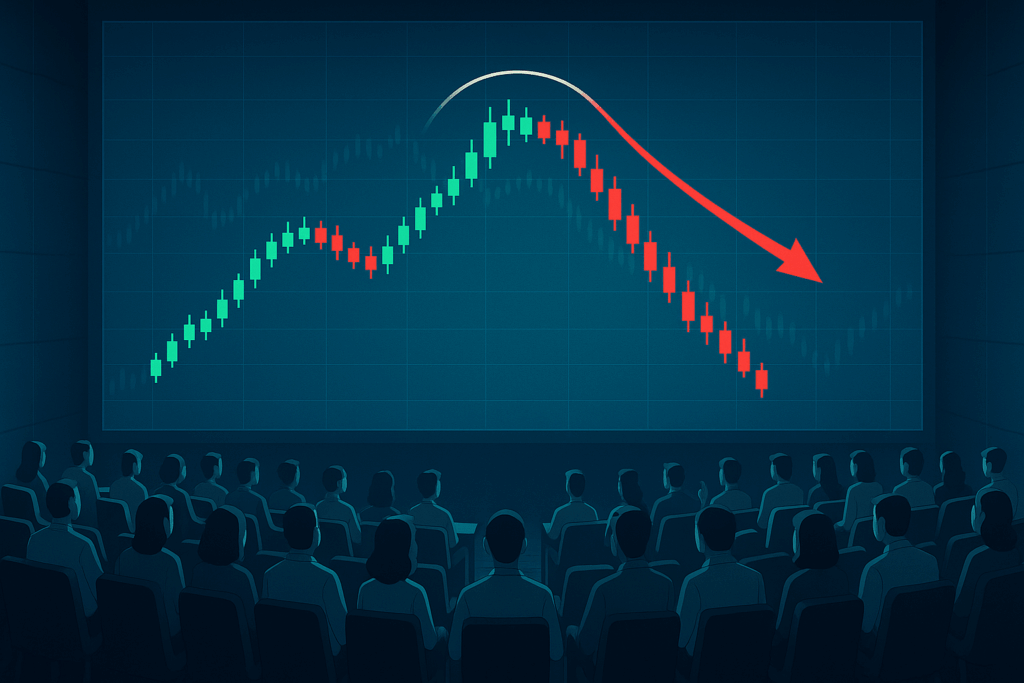
  • Institutions distribute during rallies (when prices are high, optimism is strong, and retail traders rush in).

This process allows large players to transfer risk from themselves to less experienced traders. Once they’ve distributed enough, the market typically enters a downtrend as selling pressure outweighs buying demand.

So when traders talk about distribution meaning institutions selling before a downtrend, they’re describing this exact transfer of ownership that sets the stage for falling prices.

The Market Cycle and Distribution Phase

Distribution is one of the four classic phases in Wyckoff’s market cycle theory:

  1. Accumulation – Smart money quietly builds positions at low prices.
  2. Markup (Uptrend) – Price rises as institutions support the move and attract public participation.
  3. Distribution – Institutions unload positions to eager buyers at high prices.
  4. Markdown (Downtrend) – Price falls sharply once distribution is complete.

The distribution phase is the mirror opposite of accumulation. Instead of preparing for a rally, the market is preparing for a decline.

How Institutions Sell During Distribution

Institutions can’t simply dump millions of dollars’ worth of assets at once. Doing so would cause the price to crash instantly, revealing their intentions and reducing profits.

Instead, they use distribution techniques:

  • Sideways Trading Ranges – Institutions sell gradually within a range, while price appears to consolidate.
  • False Breakouts – Pushing price slightly higher to trap retail buyers before selling into their demand.
  • News-Driven Spikes – Using positive headlines to encourage retail buying, then distributing into the rally.
  • Volume Manipulation – High volume on up-moves (selling disguised as buying), followed by low volume on down-moves.

The goal is always the same: offload large positions at high prices without alerting the market too soon.

Signs of Distribution in the Market

1. Trading Range After an Uptrend

Distribution typically occurs at the top of a strong rally. Instead of continuing higher, price moves sideways as institutions start selling.

2. Increased Volume on Up Moves

High volume during up days, but no significant progress higher, suggests selling into strength.

3. Weakness on Down Swings

When price falls within the range, volume tends to be lower. This shows that institutions aren’t supporting the market anymore.

4. Multiple Failed Breakouts

False rallies lure in late buyers. Institutions sell into these rallies, creating a pattern of bull traps.

5. Divergence in Momentum Indicators

Oscillators like RSI or MACD may show weakness while price remains flat, signaling exhaustion.

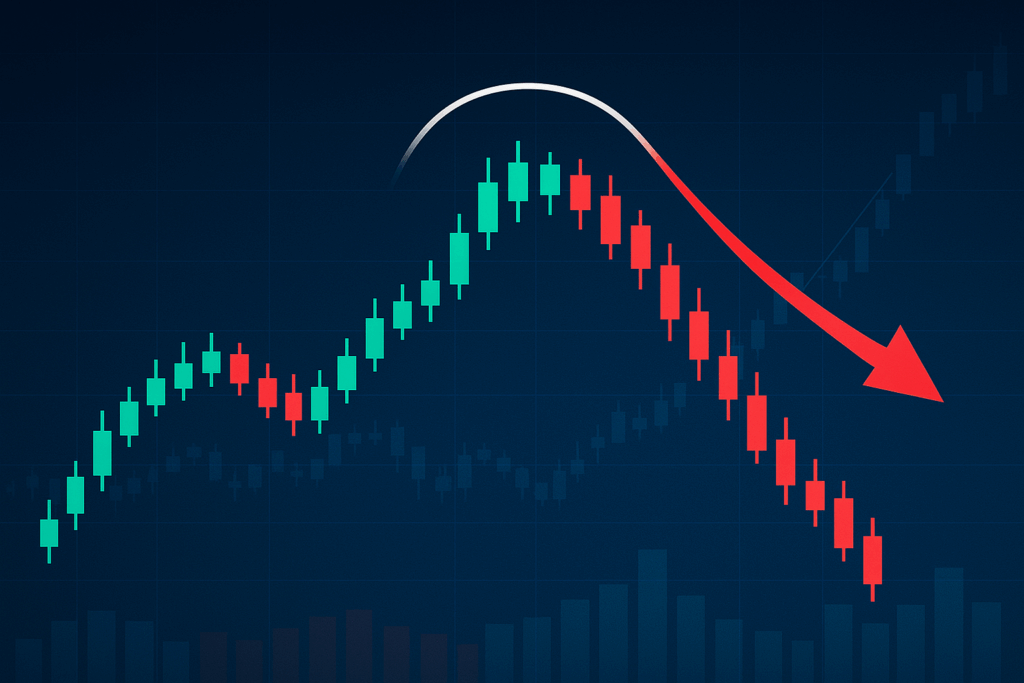
Example: Distribution Before a Downtrend

Let’s say a stock rallies from $50 to $100 over six months. Excited retail traders pile in, thinking the price will continue higher.

Instead of breaking out to $120, the stock stalls between $95 and $105. During this sideways period:

  • Volume spikes on green candles, but price doesn’t advance.
  • Several breakout attempts above $105 fail quickly.
  • Momentum indicators start diverging.

This is the distribution phase. Institutions are selling their $50–$80 entries to latecomers buying near $100.

Once enough distribution occurs, the stock begins a markdown phase, falling to $70 or lower as demand dries up.

Why Distribution Matters for Traders

Understanding distribution meaning and its role in downtrends can protect traders from major losses and even allow them to profit.

Here’s why it matters:

  • Avoid Buying at the Top – Retail traders often get trapped buying during distribution. Recognizing the signs keeps you out of trouble.
  • Early Short Opportunities – Traders who spot distribution can prepare for the downtrend with short positions.
  • Market Sentiment Insight – Distribution reflects a shift in sentiment from optimism to weakness.

Risk Management – Knowing when institutions are unloading can help you tighten stops or exit trades.

Distribution

Trading Strategies for Distribution

1. Identify the Trading Range

Look for extended sideways movement after a strong uptrend. Mark support and resistance levels.

2. Watch Volume Patterns

  • High volume with no progress = distribution.


  • Low volume bounces = weak demand.


3. Look for Failed Breakouts

Short opportunities often appear when price breaks above resistance but quickly reverses.

4. Use Confirmation

Wait for breakdowns below support with increased volume to confirm the start of the markdown phase.

5. Risk Management

  • Place stop-loss orders above resistance.


  • Keep position sizes moderate — downtrends can be volatile.


Distribution vs Accumulation

To fully grasp the meaning of distribution, it’s helpful to compare it with accumulation:

Feature

Distribution (Selling Before Downtrend)

Accumulation (Buying Before Uptrend)

Location in Cycle

After an uptrend

After a downtrend

Price Action

Sideways at high levels

Sideways at low levels

Institutional Role

Selling to retail

Buying from retail

Volume Behavior

High on up moves, low on down moves

High on down moves, low on up moves

Outcome

Leads to markdown (downtrend)

Leads to markup (uptrend)

This comparison highlights the inverse relationship between the two phases.

Real-World Example: Crypto Distribution

A well-known case of distribution happened in the Bitcoin 2021 top:

  • BTC rose from $10,000 in 2020 to nearly $64,000 in April 2021.


  • For weeks, Bitcoin traded between $55,000–$64,000 in a wide range.


  • Volume was high on rallies, but BTC couldn’t break higher sustainably.


  • Once institutions finished distributing, BTC dropped to $30,000 within weeks.


This was a textbook distribution pattern, showing how institutions quietly offloaded while retail buyers believed the bull market would continue forever.

Common Mistakes Traders Make During Distribution

  • Assuming Sideways = Accumulation – Not every consolidation means higher prices. Context matters.


  • Chasing Breakouts Too Early – Breakouts during distribution are often traps.


  • Ignoring Volume – Price alone isn’t enough. Volume reveals whether moves are genuine.


  • Overleveraging – Distribution often precedes sharp markdowns, which can liquidate overleveraged traders.


How to Stay Ahead of Distribution

To avoid being caught in institutional distribution, traders should:

  • Study Wyckoff Theory – His concepts of accumulation, markup, distribution, and markdown remain highly relevant.


  • Track Smart Money Flow – Tools like COT reports, order flow analysis, and volume profile can reveal institutional behavior.


  • Remain Objective – Don’t let euphoria blind you at market tops.


Plan Both Ways – Always have a strategy for if the market breaks down as well as up.

Distribution

FAQs About Distribution in Trading

Q: Is distribution always followed by a downtrend?
A: Most of the time, yes. However, the extent of the downtrend varies depending on overall market conditions.

Q: How long does distribution last?
A: It can last days, weeks, or even months, depending on how much capital institutions need to offload.

Q: Can retail traders benefit from distribution?
A: Absolutely. Traders who recognize it early can avoid losses and even profit by shorting or preparing for the markdown phase.

Q: How is distribution different from consolidation?
A: Distribution happens at market tops with signs of selling pressure. Consolidation can occur mid-trend without necessarily signaling reversal.

Conclusion

So, what does distribution meaning institutions selling before downtrend really boil down to?

It’s the phase of the market cycle where smart money exits quietly, transferring risk to retail traders who are still optimistic.

By understanding distribution, traders can:

  • Avoid the costly mistake of buying near the top.
  • Recognize when institutions are preparing for a downtrend.
  • Position themselves to profit during the markdown phase.

The ability to spot distribution is a skill that separates professional traders from retail amateurs. Institutions will always sell before a downtrend — your job as a trader is to see the signs before the rest of the market does.