The Relative Strength Index (RSI) is one of the most popular and widely used technical indicators in Forex trading. Whether you are a beginner learning how to read charts, or an experienced trader fine-tuning your strategy, understanding RSI can make a big difference in your decision-making. In this article, we’ll cover everything you need to know about RSI — how it works, how to calculate it, the best strategies to use, and common mistakes traders should avoid.
What is RSI?
The Relative Strength Index (RSI) is a momentum oscillator created by J. Welles Wilder Jr. in 1978. It measures the speed and magnitude of recent price changes to evaluate whether a currency pair (or any financial asset) is overbought or oversold.
The RSI is displayed as a line graph that moves between 0 and 100. Traditionally:
- An RSI above 70 suggests the asset may be overbought (potentially due for a correction or pullback).
- An RSI below 30 suggests the asset may be oversold (potentially due for a bounce or reversal).
This simple scale gives traders a quick snapshot of the market’s momentum.
How RSI is Calculated
The formula for RSI may look complex, but it’s built on simple averages.
- Calculate the average gain over a specific period (usually 14 periods).
- Calculate the average loss over the same period.
- Divide the average gain by the average loss to get the Relative Strength (RS).
- Apply the formula:
RSI = 100 – [100 ÷ (1 + RS)]
For example, if during the last 14 periods the average gain was 1.2% and the average loss was 0.6%, RS = 1.2 ÷ 0.6 = 2.
Plugging this into the formula:
RSI = 100 – [100 ÷ (1 + 2)]
RSI = 100 – [100 ÷ 3]
RSI = 100 – 33.33 = 66.67
This means RSI is showing momentum close to overbought levels.
Why RSI Matters in Forex Trading
Unlike some technical indicators that are hard to interpret, RSI is simple and effective. It helps traders answer three crucial questions:
- Is the market trending strongly or losing steam?
RSI helps identify if momentum is fading. - Is a reversal coming?
When RSI is extremely high or low, it may signal that a trend is about to change. - Where are the best entry and exit points?
Traders can use RSI to decide when to buy or sell, avoiding emotional trading.
For Forex traders, who often deal with fast-moving markets and tight margins, this clarity is invaluable.
Standard RSI Levels: 70 and 30
The classic interpretation uses the levels of 70 and 30:
- Above 70: Market could be overbought → Possible sell signal.
- Below 30: Market could be oversold → Possible buy signal.
However, in trending markets, RSI may stay overbought or oversold for a long time. That’s why experienced traders adjust these levels or combine RSI with other indicators.
Advanced RSI Settings: 80/20 and 60/40
Some traders prefer alternative thresholds:
- 80/20: Gives fewer but stronger signals (useful in volatile pairs like GBP/JPY).
- 60/40: Helps capture trends earlier and reduces false signals (often used in long-term trading).
By adjusting RSI levels, you can tailor it to fit your personal trading style.
RSI Divergence
Divergence occurs when the price and RSI move in opposite directions. This is one of the most powerful signals RSI can provide.
- Bullish Divergence: Price makes lower lows, but RSI makes higher lows. This suggests the downtrend is weakening, and a reversal could follow.
- Bearish Divergence: Price makes higher highs, but RSI makes lower highs. This suggests the uptrend is losing strength.
Example: If EUR/USD keeps climbing but RSI fails to confirm the new highs, it could be a warning that buyers are exhausted.
RSI Trading Strategies
Here are some of the most effective ways traders use RSI:
1. Overbought and Oversold Strategy
- Buy when RSI drops below 30 and crosses back up.
- Sell when RSI rises above 70 and crosses back down.
This is the simplest method but works best in range-bound markets.
2. RSI Divergence Strategy
- Look for bullish or bearish divergence between price and RSI.
- Combine with candlestick patterns (like Doji or Engulfing) for stronger confirmation.
3. Trend Confirmation with RSI
- In strong uptrends, RSI often stays above 40.
- In strong downtrends, RSI often stays below 60.
- Traders use this to confirm trend direction and avoid counter-trend trades.
4. RSI + Moving Average Combo
- Combine RSI with a Moving Average (MA).
- Example: Enter a buy trade when RSI crosses above 30 while the price is above the 50-period MA.
This helps filter false signals and adds confluence.
Best Timeframes for RSI in Forex
The effectiveness of RSI depends on your trading style:
- Scalping/Day Trading: 1-minute to 15-minute charts (quick RSI signals).
- Swing Trading: 1-hour to 4-hour charts (balance between noise and reliability).
- Position Trading: Daily or weekly charts (long-term confirmation).
For most Forex traders, the 14-period RSI on the 1-hour or 4-hour chart is the sweet spot.
Strengths of RSI
- Simple and beginner-friendly.
- Works across all assets: Forex, stocks, crypto.
- Powerful when combined with other indicators.
- Highlights hidden divergences before price reacts.
Limitations of RSI
- Can give false signals in strong trends.
- Overbought does not always mean “sell” (price can keep climbing).
- Lagging nature: RSI is based on past data.
- Needs confirmation from other tools (support/resistance, moving averages, etc.).
The key is to avoid using RSI in isolation. Always combine it with price action or another indicator.
Common Mistakes Traders Make with RSI
- Selling too early in a strong trend: Just because RSI is above 70 doesn’t mean the trend will reverse immediately.
- Ignoring timeframe context: An RSI signal on a 5-minute chart is much weaker than one on a daily chart.
- Not adjusting RSI levels: Using 70/30 blindly without considering volatility can mislead traders.
- Forgetting risk management: RSI is a tool, not a guarantee. Always use stop-loss orders.
Practical Example: RSI on EUR/USD
Imagine you’re trading EUR/USD on the 4-hour chart:
- RSI dips to 28, signaling oversold conditions.
- At the same time, price touches a strong support level.
- You see a bullish candlestick formation (hammer candle).
This confluence of signals strengthens your buy decision. RSI alone would not be enough, but combined with support and candlestick analysis, it becomes a reliable trade setup.
RSI vs Other Indicators
RSI is often compared with other momentum tools:
- MACD (Moving Average Convergence Divergence): Both measure momentum, but MACD is slower and better for trend confirmation.
- Stochastic Oscillator: Similar to RSI but more sensitive, giving earlier signals (and sometimes more false alarms).
- Moving Averages: Trend-following, while RSI is momentum-based.
The best results come when RSI is used alongside these indicators.
Tips for Using RSI Effectively
- Always zoom out: Check higher timeframes for context.
- Look for divergence — it’s one of the strongest RSI signals.
- Don’t rely on RSI alone. Combine with support/resistance, Fibonacci retracement, or candlestick analysis.
- Adjust RSI thresholds depending on volatility.
- Practice on a demo account before applying RSI strategies in live trading
Conclusion
The Relative Strength Index (RSI) is a powerful and versatile tool that can help Forex traders spot opportunities and avoid bad entries. By learning how to interpret RSI correctly — and by combining it with other technical tools — you can gain a real edge in the market.
At InvidiaTrade, we believe that education is the foundation of successful trading. Mastering indicators like RSI is a step toward building your own profitable strategy.
Disclaimer
Trading Forex and other financial instruments involves significant risk and may not be suitable for all investors. This article is for educational purposes only and should not be considered financial advice. Past performance of RSI or any other indicator is not a guarantee of future results. Always do your own research and consult with a licensed financial advisor before making trading decisions.

What Is a Funded Trading Account? How It Works
A funded trading account has become a big topic in the trading space. Many traders are interested in it because it offers access to capital

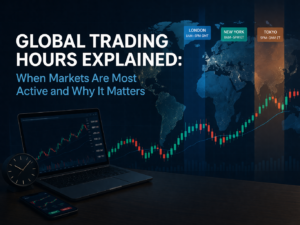
Global Trading Hours Explained: When Markets Are Most Active and Why It Matters
Financial markets operate across multiple time zones. As a result, trading takes place almost continuously throughout the week. While this constant access creates flexibility, it

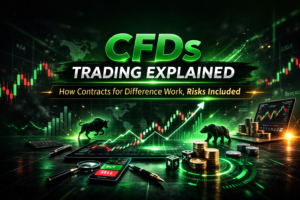
CFDs Trading Explained: How Contracts for Difference Work, Risks Included
Many people enter the markets looking for clarity. They hear about forex, stocks, indices, and commodities, but they are still unsure how trading actually works.

Essential Trading Tools Every Serious Trader Uses (And How to Choose the Right Ones)
A practical overview of how a forex demo account works and what traders should know before getting started.

Trading News That Actually Matters: How to Filter Market Noise From Real Opportunity
Most traders do not lose because they are uninformed. They lose because they are overloaded. Trading news is constant. You can refresh your feed every

Trading Analysis Explained: How Professionals Read Markets Before Placing a Trade
Disclaimer (InvidiaTrade): This article is for educational purposes only and does not provide financial, investment, or trading advice. Trading carries risk, and you may lose