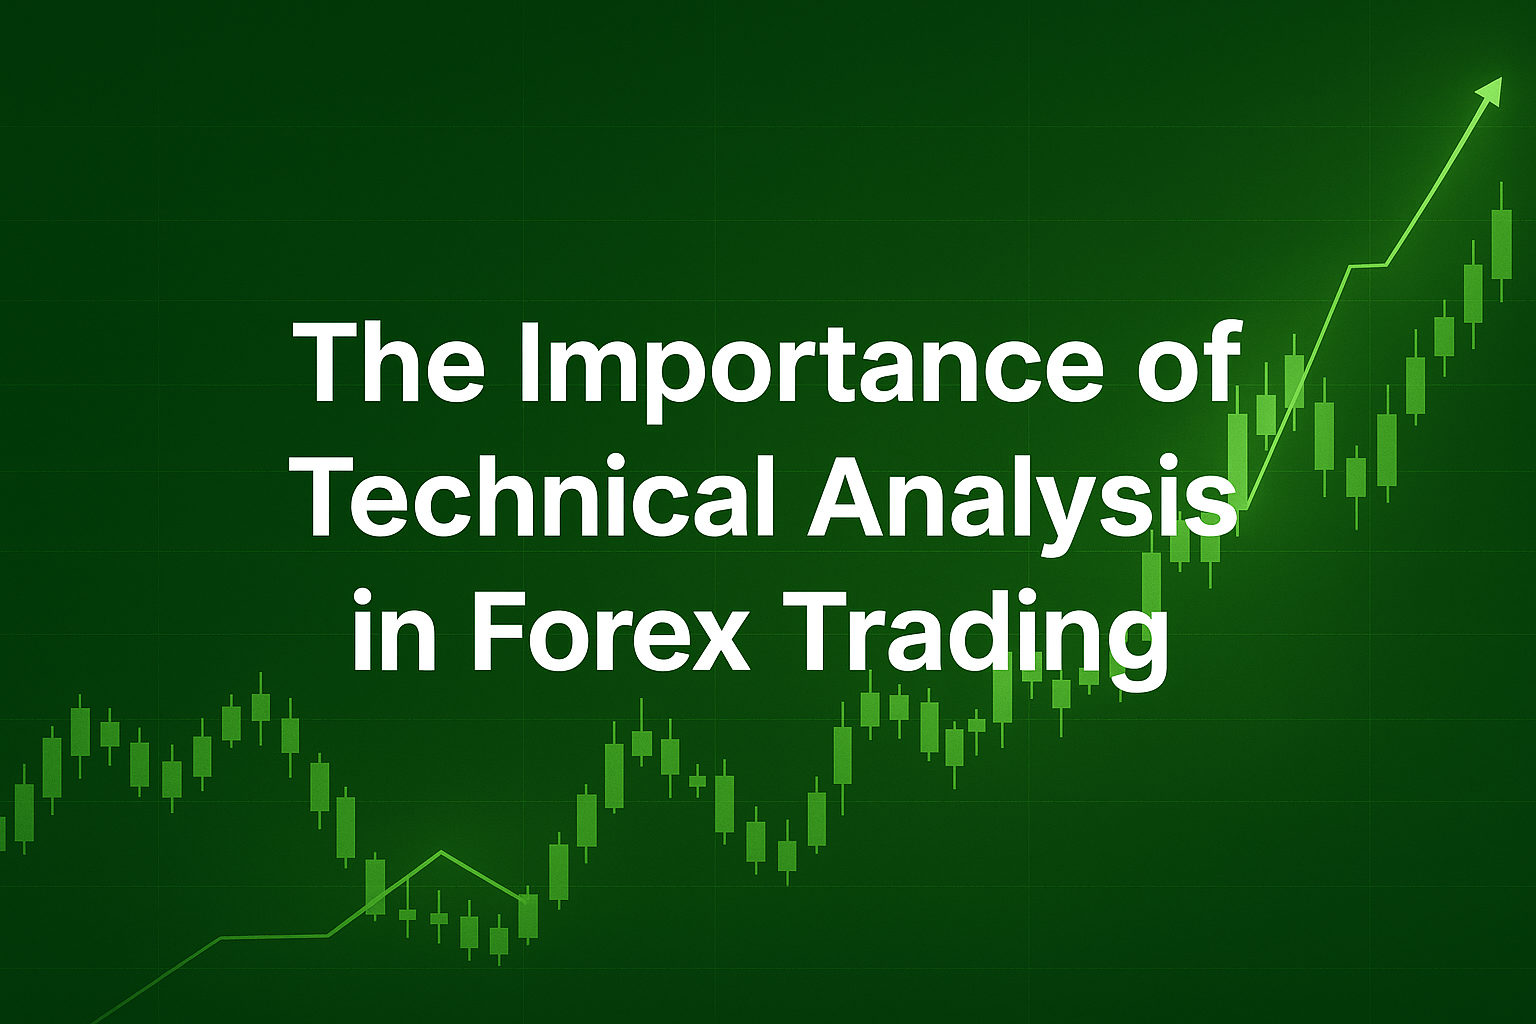
Introduction
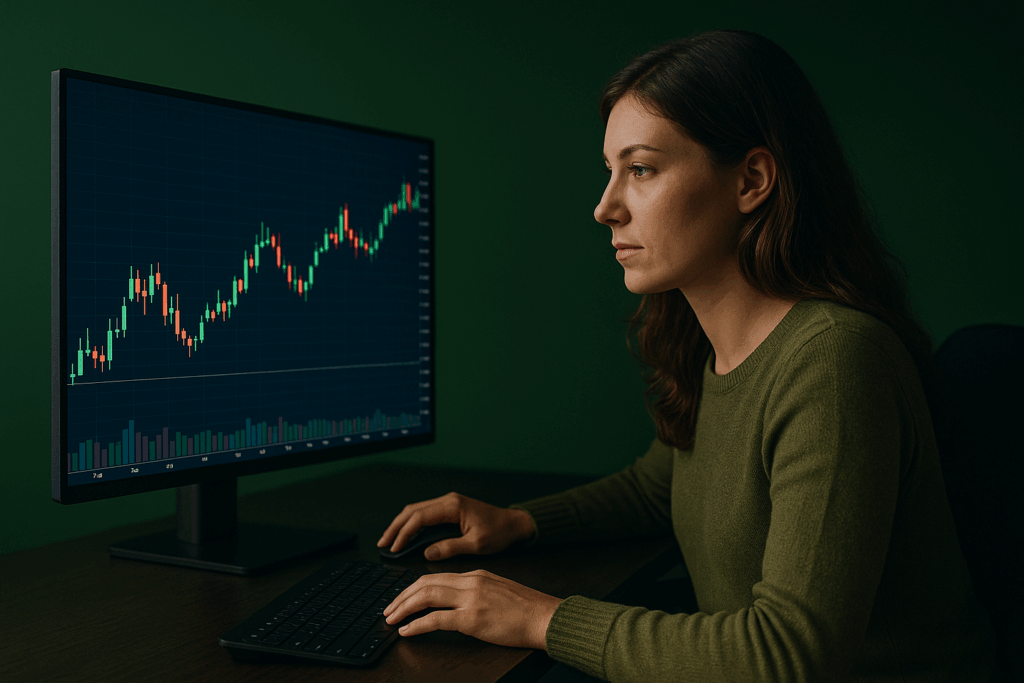
Forex trading is one of the most dynamic financial markets in the world. Prices move every second, influenced by economic data, central banks, and global sentiment. In such a fast-paced environment, traders need more than instinct—they need structure, clarity, and consistency. That’s exactly what technical analysis provides.
Technical analysis is the study of price movements through charts, indicators, and historical data. It gives traders a language to interpret what the market is doing, rather than guessing what it might do next. By reading price patterns, traders can identify trends, potential reversals, and high-probability entry points.
At InvidiaTrade, we understand that traders who rely on structured analysis perform more confidently and make better decisions. This article explores why technical analysis remains one of the most powerful tools in Forex, how to use it effectively, and why combining it with modern trading platforms and disciplined risk management can transform your results.
1. What Is Technical Analysis?
Technical analysis is built on a simple but powerful principle: price reflects all available information. Every political decision, economic report, and trader’s emotion is already represented in the price. Instead of focusing on external news, technical traders focus on how price moves and reacts.
By examining charts, traders can identify patterns that repeat over time. These patterns often reveal the balance between buying and selling pressure, allowing traders to forecast where price may move next.
Some of the most common tools used include:
- Trend lines – Show the direction of the market over time.
- Support and resistance levels – Highlight areas where price has historically reacted.
- Indicators – Mathematical calculations like Moving Averages or RSI that measure momentum and strength.
- Chart patterns – Visual shapes such as flags, wedges, and double tops that often precede reversals or continuations.
Technical analysis transforms raw price data into actionable insights, helping traders make decisions based on evidence, not emotion.
2. Why Technical Analysis Is Essential in Forex
The Forex market is open 24 hours a day, with trillions of dollars traded daily. Because it’s decentralized and globally influenced, it can be unpredictable. Technical analysis helps bring order to this complexity.
a. It Reveals Market Direction
One of the first things every trader must identify is the market trend. Is the price moving up, down, or sideways? Technical analysis helps answer that question clearly. Recognizing trend direction allows traders to trade with the market instead of against it.
b. It Helps Determine Entry and Exit Points
Indicators and price patterns give traders visual confirmation of potential opportunities. For example, a breakout above resistance combined with strong momentum may indicate the beginning of a bullish move.
Technical analysis doesn’t just show what to trade—it shows when to trade.
c. It Applies to Any Timeframe
Whether you trade on a one-minute chart or a weekly chart, technical analysis follows the same logic. This makes it versatile for all trading styles—from short-term scalping to long-term swing trading.
d. It Aligns With Algorithmic and Automated Strategies
Many algorithmic systems and trading bots are built on technical principles. Platforms like InvidiaTrade integrate tools that support both manual and automated technical trading, allowing traders to apply consistent strategies efficiently.
3. Technical vs. Fundamental Analysis
Both types of analysis are valuable, but they approach the market differently.
- Fundamental analysis studies the economic and political factors that influence currencies—interest rates, inflation, employment, and GDP growth. It explains why the market may move.
- Technical analysis studies how traders react to those fundamentals. It identifies when movements occur by reading actual price action.
For instance, if the Federal Reserve raises interest rates, fundamental analysis may suggest a stronger USD. Technical analysis helps determine the right moment to enter a USD trade by confirming momentum, breakouts, or pullbacks.
Smart traders often combine both methods. Fundamentals guide direction, while technicals refine timing.
4. The Key Components of Technical Analysis
To use technical analysis effectively, traders need to understand its three core components: price action, trend identification, and confirmation indicators.
a. Price Action
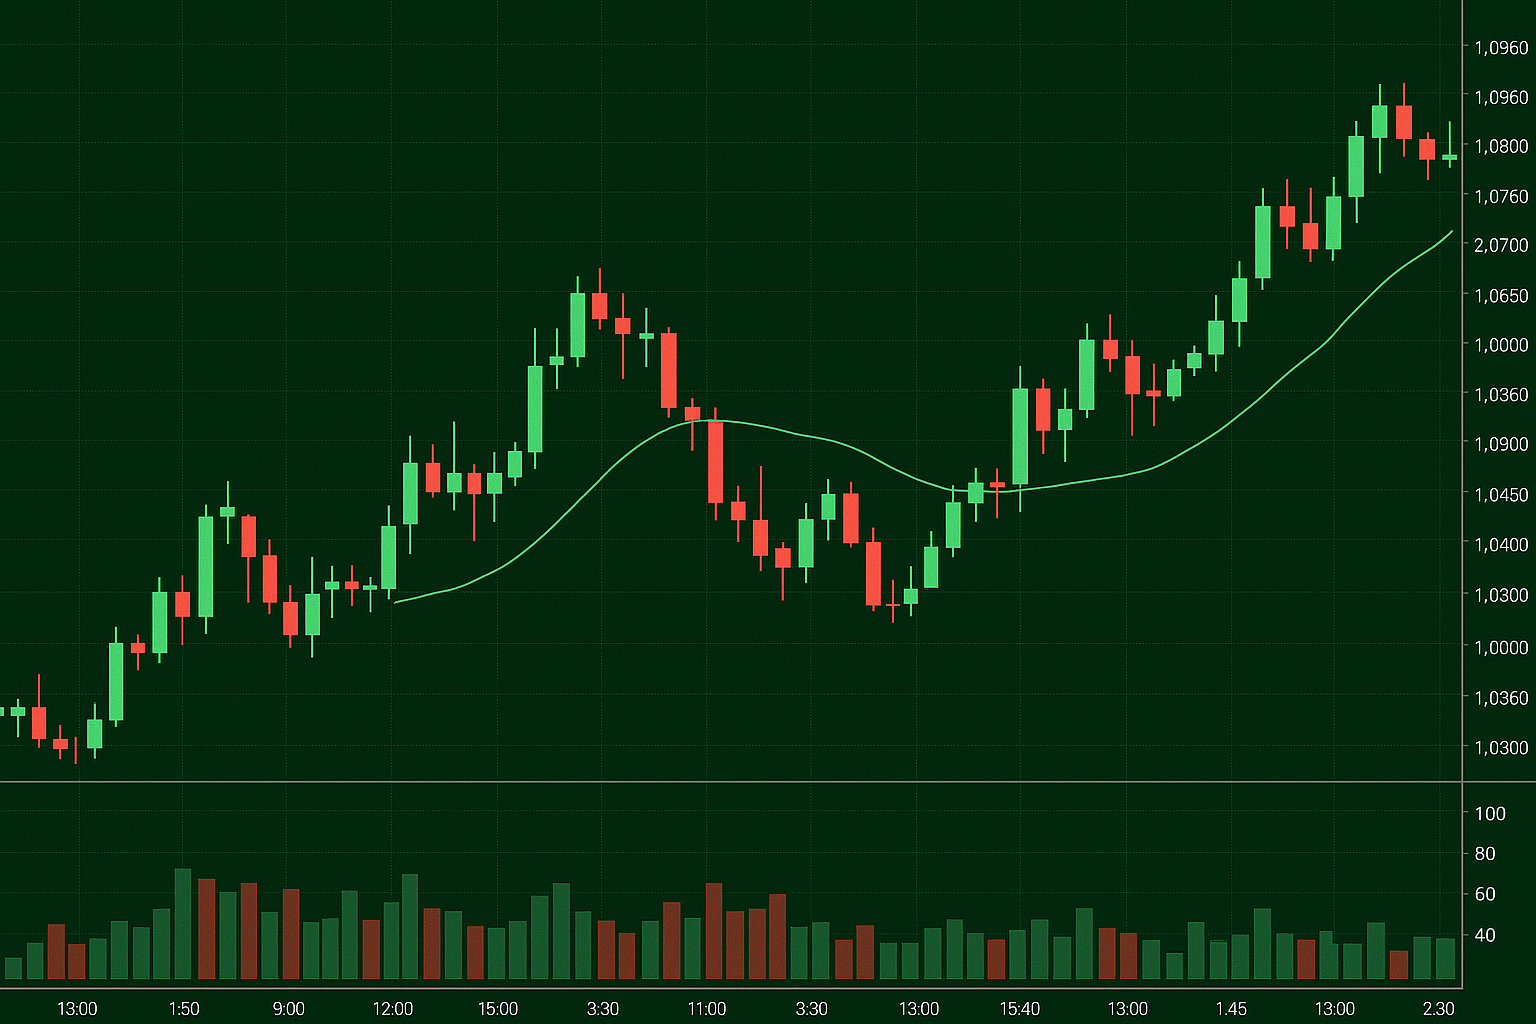
Price action is the raw movement of price without any indicators. Candlestick patterns, wicks, and bodies tell stories of supply and demand. For example, long wicks often show rejection of certain levels—an early clue to potential reversals.
b. Trends and Market Structure
Markets don’t move randomly. They form higher highs and higher lows in an uptrend, and lower highs and lower lows in a downtrend. Recognizing this structure helps traders align with the dominant direction.
c. Indicators and Tools
Indicators help quantify what the eyes see. Popular choices include:
- Moving Averages – Smooth price data to reveal the underlying trend.
- RSI (Relative Strength Index) – Identifies overbought or oversold conditions.
- MACD (Moving Average Convergence Divergence) – Shows momentum shifts.
- Bollinger Bands – Measure volatility and highlight breakout potential.
- Fibonacci Retracements – Identify correction levels where price may react.
Together, these tools create a comprehensive view of market strength and potential opportunities.
5. The Power of Trends
One of the oldest sayings in trading is “The trend is your friend.” Following the trend increases the probability of success because you are moving with the market majority.
Traders use several techniques to identify and confirm trends:
- Moving average crossovers – When a short-term average crosses above a long-term one, it signals bullish strength.
- Trend channels – Drawn parallel to trend lines, they help identify dynamic support and resistance.
- Higher highs and higher lows – A simple but powerful method to confirm bullish trends.
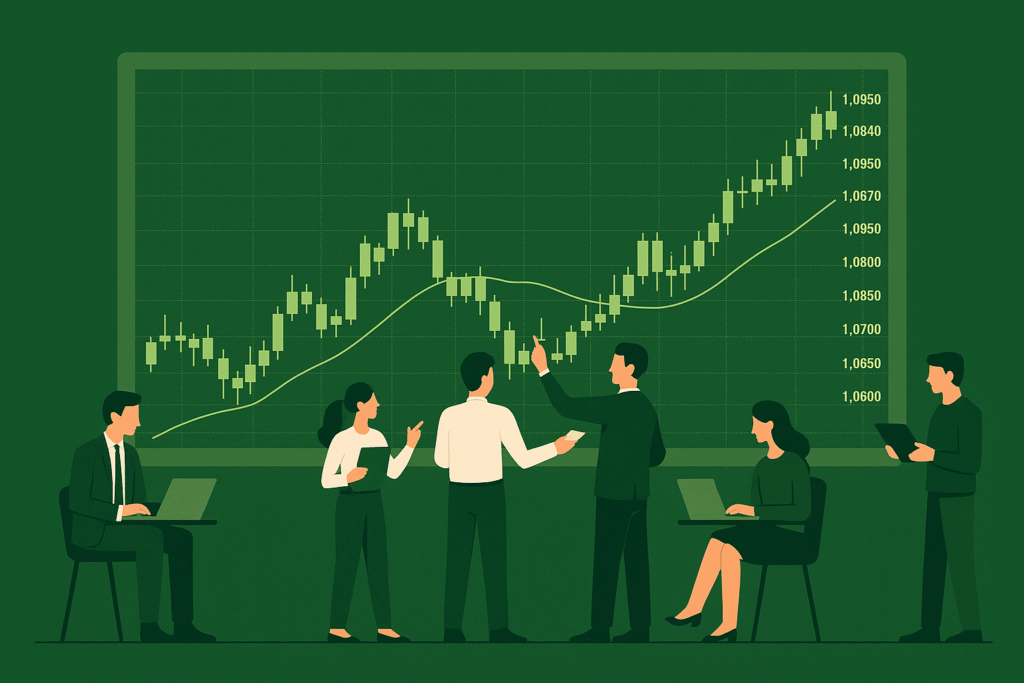
At InvidiaTrade, our platform provides advanced charting tools that make trend analysis intuitive and precise, even for beginners.
6. Support and Resistance: The Foundation of Every Chart
Support and resistance are zones where price historically struggles to move past. Support acts as a floor that stops price from falling, while resistance acts as a ceiling that prevents it from rising.
Traders use these zones to anticipate reactions. For example:
- If price bounces off support, it may present a buying opportunity.
- If price breaks through resistance with strong volume, it may signal a bullish breakout.
Understanding these levels helps traders plan entries, exits, and stop-loss placement with greater accuracy.
7. Combining Multiple Indicators
No single indicator is perfect. The real power of technical analysis comes from confluence—the alignment of multiple signals pointing in the same direction.
For example:
- A trader identifies an uptrend using moving averages.
- RSI shows a pullback to oversold territory.
- Price reaches a Fibonacci retracement level at 61.8%.
When all three align, the probability of a successful trade increases significantly. InvidiaTrade’s platform allows traders to overlay indicators, draw tools, and analyze multiple timeframes simultaneously—helping create stronger, evidence-based strategies.
8. Building a Technical Trading Plan
A technical trading plan should clearly define your process from start to finish.
Here’s a simple structure to follow:
- Define the Trend: Identify whether the market is bullish, bearish, or ranging.
- Mark Key Levels: Draw support and resistance zones.
- Set Entry Conditions: Decide what signals must align before entering a trade.
- Set Exit Rules: Determine take-profit and stop-loss points before execution.
- Risk Management: Limit your exposure to a small percentage of your account per trade.
- Review and Adjust: Keep a trading journal to analyze your performance and improve over time.
InvidiaTrade’s user interface supports all these steps, offering intuitive order placement, live charts, and execution precision that technical traders depend on.
9. The Role of Risk Management
No analysis is complete without risk control. Even perfect setups can fail, and protecting capital is the first rule of trading longevity.
Technical analysis helps define risk by providing logical stop-loss placements based on chart structure. Traders can calculate position size according to distance from entry to stop-loss, ensuring each trade fits within acceptable risk limits.
For example, if a trader risks 1% of capital per trade and places a stop-loss 40 pips away, they can use position sizing tools to determine the correct lot size. InvidiaTrade’s platform simplifies this process, letting traders manage exposure precisely.
10. Automation and Modern Trading Tools
The combination of technology and technical analysis has changed the trading landscape. Algorithms and Expert Advisors (EAs) now use pre-set technical rules to scan markets, identify setups, and execute trades instantly.
While automation removes human emotion from trading, it still relies on solid technical logic. Traders using automated tools should understand the underlying strategies to maintain control and oversight.
InvidiaTrade supports both manual and automated systems, providing the speed, liquidity, and reliability traders need to execute efficiently in global markets.
11. Avoiding Common Mistakes in Technical Analysis
Even though technical analysis is powerful, misuse can lead to losses. Common errors include:
- Overusing indicators: Too many indicators can create conflicting signals.
- Ignoring risk management: Focusing only on entries without managing exits.
- Chasing trades: Entering late after signals have passed.
- Lack of consistency: Constantly switching strategies instead of refining one.
Successful traders stay disciplined, patient, and systematic. They understand that consistency, not complexity, drives performance.
12. Practice, Discipline, and Continuous Learning
Technical analysis is not a one-time skill. It’s a lifelong process of observation, testing, and improvement. The more you analyze charts, the more familiar price movements become. Over time, patterns that once looked random start to make sense.
At InvidiaTrade, we encourage traders to combine education with practice. Our goal is to provide a platform where both new and experienced traders can develop strategies, test ideas, and grow their confidence in a secure trading environment.
13. Integrating Technical Analysis With Trading Psychology
While charts and indicators form the foundation of technical trading, mindset determines how well traders use them. Fear and greed can lead to impulsive decisions, even when technical setups are strong.
Technical analysis promotes objectivity. By following predefined rules and measurable signals, traders reduce emotional influence and focus on execution. When combined with discipline and patience, it becomes a roadmap toward consistent decision-making.
14. The Edge of Precision and Execution
A trading strategy is only as effective as the platform that executes it. Technical analysis identifies opportunities—but execution speed and reliability turn those opportunities into real results.
That’s where InvidiaTrade gives traders a clear advantage. Our technology ensures:
- Fast execution speeds to avoid slippage.
- Real-time price feeds for accurate chart analysis.
- Advanced order types for precision in volatile markets.
- Secure infrastructure to protect data and transactions.
Technical analysis finds the setup; execution ensures the outcome.
15. Conclusion: The Foundation of Successful Trading
Technical analysis remains one of the most reliable pillars of Forex trading. It provides structure in a market that often feels chaotic. By studying price action, trends, and chart patterns, traders can make decisions based on evidence rather than emotion.
Combined with proper risk management, emotional discipline, and a reliable trading platform, technical analysis becomes more than a tool—it becomes a long-term strategy for consistency and growth.
At InvidiaTrade, we believe that understanding the market technically is not optional; it’s essential. Whether you trade manually, follow automated systems, or use hybrid approaches, technical analysis gives you the clarity needed to trade with confidence in every market condition.
Disclaimer
Trading Forex and other leveraged products involves significant risk and may not be suitable for all investors. You could lose more than your initial investment. Past performance is not indicative of future results. The information provided in this article is for educational purposes only and should not be considered financial advice. Always conduct your own research and trade responsibly. InvidiaTrade does not guarantee profits and encourages clients to use proper risk management at all times.

What Is a Funded Trading Account? How It Works
A funded trading account has become a big topic in the trading space. Many traders are interested in it because it offers access to capital
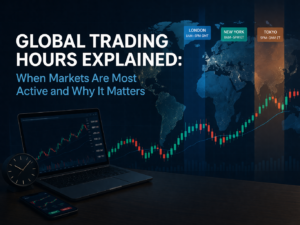
Global Trading Hours Explained: When Markets Are Most Active and Why It Matters
Financial markets operate across multiple time zones. As a result, trading takes place almost continuously throughout the week. While this constant access creates flexibility, it
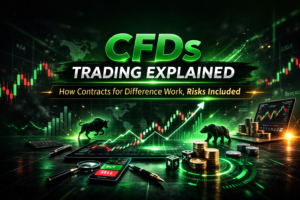
CFDs Trading Explained: How Contracts for Difference Work, Risks Included
Many people enter the markets looking for clarity. They hear about forex, stocks, indices, and commodities, but they are still unsure how trading actually works.
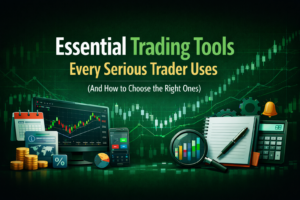
Essential Trading Tools Every Serious Trader Uses (And How to Choose the Right Ones)
A practical overview of how a forex demo account works and what traders should know before getting started.

Trading News That Actually Matters: How to Filter Market Noise From Real Opportunity
Most traders do not lose because they are uninformed. They lose because they are overloaded. Trading news is constant. You can refresh your feed every
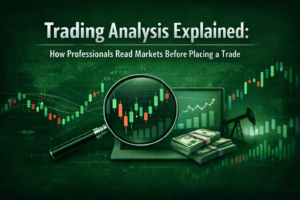
Trading Analysis Explained: How Professionals Read Markets Before Placing a Trade
Disclaimer (InvidiaTrade): This article is for educational purposes only and does not provide financial, investment, or trading advice. Trading carries risk, and you may lose